Summary
AI data centers function as infrastructure for artificial intelligence computations, with server rack densities over 50 kW and heat fluxes up to 1 kW/cm². Many, but not all, of these facilities use water for thermal regulation and operational maintenance, with the extent of usage varying significantly by cooling methodology. This article provides a technical analysis of water consumption patterns, contamination mechanisms, and treatment technologies, including reverse osmosis, membrane bioreactors, and physicochemical systems. It incorporates thermodynamic, hydrodynamic, and kinetic models such as Water Usage Effectiveness (WUE), Cycles of Concentration (COC), and membrane flux equations. The discussion covers equipment sequences in treatment trains, pre-treatment chemical equilibria, process kinetics, and compliance with NPDES regulations, providing guidance to address water stress in data center locations while maintaining operational reliability amid escalating regulatory and ethical pressure.

Table of Contents
- Introduction
- Water Usage in AI Data Centers
- Data Centers Cooling Methods Overview
- Quantitative Assessment of Daily Consumption
- Thermodynamic Rationale for Water in Cooling Systems
- Sources and Pre-Treatment of Water
- Primary Water Sources
- Pre-Treatment Processes and Chemical Considerations
- Water Contamination Mechanisms
- Thermal and Chemical Pollutants
- Kinetic Models of Contaminant Accumulation
- Wastewater Treatment Methods
- Physicochemical Treatment Techniques
- Advanced Biological and Membrane Processes
- Reuse, Recycling, and Discharge Options
- Onsite Reuse and Closed-Loop Systems
- Discharge to Municipal WWTP or Environment via NPDES Permits
- Water Cycle Flow in Data Centers
- Ethical Engineering vs. Financial Offsets
- Case Studies in AI Data Center Water Management
- Challenges in AI Data Center Water Management
- Solutions and Future Innovations
- Conclusion
- Glossary
- FAQ
- Bibliography
1. Introduction
The AI data center industry stands at a regulatory and ethical precipice, where the operational imperative for thermal efficiency directly conflicts with the risks of local water scarcity and resource depletion. High-density servers generate heat fluxes requiring junction temperatures below 85°C. The facilities that utilize evaporative cooling systems for thermal management rely on water's properties (specific heat capacity of 4.184 J/g·K and latent heat of vaporization of 2257 kJ/kg) for effective cooling. Yet, this dependence exacerbates water stress in hotspots like Phoenix and Northern Virginia, where some facilities consume volumes equivalent to thousands of households, potentially leading to aquifer complaints, regulatory fines, and business disruptions. Evolving since the mid-2000s with hyperscale growth and accelerating post-2022 amid AI's approximately 0.0003 kWh per-query, water management now demands rigorous treatment to mitigate these risks. This document examines assessing water usage, configuring treatment trains, modeling contamination kinetics, and implementing reuse strategies as tools for compliance and downtime reduction. Models like osmotic flux in reverse osmosis Jw = A(Delta P - Delta π) and chemical equilibria serve not merely as technical methods but as risk management instruments, ensuring NPDES adherence while balancing computational demands with resource constraints. Addressing these processes is required to avoid operational failures and align business viability with societal responsibilities.
2. Water Usage in AI Data Centers
Quantifying water usage in AI data centers is fundamental to designing wastewater treatment systems, as it determines the scale of infrastructure and identifies opportunities for efficiency improvements. This section explains how to measure consumption, applies thermodynamic principles to cooling processes, and highlights why these metrics are used for sustainable and compliant facility design.
2.1 Data Centers Cooling Methods Overview
Data centers employ a variety of cooling methods, including air-based, liquid-based, and hybrid systems. It is critical to note that cooling methods vary dramatically in their water consumption, and many use very little or no water. For instance, air-based (dry) or immersion cooling systems often avoid water altogether. Conversely, methods like evaporative cooling, liquid-based cooling, and computer room air handlers (CRAH) do involve significant water usage and thus require extensive filtration and treatment to prevent scaling and corrosion. Closed-loop designs typically recirculate and internally treat coolant without release, but others may discharge wastewater, potentially after on-site treatment to remove pollutants, depending on local permits, or clean and reuse it to minimize environmental impact.
Table 1: Snapshot of Data Center Cooling Type in North America
| Cooling Type | % | Influent Filtration | Wastewater Treatment |
|---|---|---|---|
| Air-Based | 60% | No (air-only; basic for evaporative) | No (minimal water) |
| Liquid-Based | 40% | Yes (filtration & chemicals) | Yes (treat blowdown) |
| CRAH/CRAC (Air) | 41% | Yes for CRAH; No for CRAC | Yes for CRAH; No for CRAC |
| Direct Liquid (DLC) | 22% | Yes (advanced filters) | Yes (treat coolant) |
| Immersion | 10% | No (dielectric fluids) | No (recirculated) |
| Closed-Loop | ~40% | Yes (for coolant) | No (internal reuse) |
| Indirect Free | 85% | No (air-to-air) | No (no water) |
| Direct Economization | 75% | No (outside air) | No (no wastewater) |
2.2 Quantitative Assessment of Daily Consumption
Hyperscale AI data centers typically consume between 1.14 and 1.70 million liters of water per day, a volume equivalent to the domestic needs of ~ 1,100 to 1,500 households. This usage increases with AI-specific tasks, such as model training, which can indirectly require up to 700,000 liters through associated power generation. Engineers use Water Usage Effectiveness (WUE) as a metric to benchmark and optimize consumption:
A benchmark value for efficient facilities is 1.8 L/kWh. To apply this, consider a 100 MW data center operating at a Power Usage Effectiveness (PUE) of 1.2: calculate IT energy as 100 / 1.2 ≈ 83.3 MW, daily IT energy as 83.3 x 24 = 2000 MWh, and thus daily water usage as 1.8 x 2,000,000 = 3,600,000 L. Evaporative losses account for approximately 60% of this total, with the remainder as blowdown, managed through Cycles of Concentration , typically ranging from 4 to 6. Practitioners should employ these calculations during facility planning or retrofits, adjusting for variables like computational load. Accurate quantification helps avoid the risks of under designed infrastructure, which could lead to regulatory non-compliance, or overdesigned systems, which unnecessarily increase costs.
2.3 Thermodynamic Rationale for Water in Cooling Systems
The thermodynamic foundation for water's role in cooling systems lies in its capacity to absorb and dissipate heat, particularly through evaporation in cooling towers. The heat rejection process follows , where m is the mass of evaporated water. You can calculate the evaporation rate (E) as:
For a 50 MW heat load at 80% efficiency (η = 0.8), E ≈ 99,537 kg/h. From this, blowdown , and makeup water (M) = E + B + drift losses (typically 0.02% of the circulation rate). To optimize, increasing COC (typically from 4 to 6) using chemical additives is the first line of defense against treatment system CAPEX, as a higher COC directly reduces blowdown volumes and thus the required capacity of any downstream treatment infrastructure. This approach is used because evaporative cooling, while achieving coefficients of performance greater than 5, can contribute to water stress in data center hotspots like Northern Virginia if not managed, necessitating tailored treatment for concentrated effluents.
3. Sources and Pre-Treatment of Water
Selecting water sources and applying pre-treatment are steps to prevent fouling and maintain cooling system efficiency. This section discusses common sources, pre-treatment processes and equipment trains, and explains their importance in ensuring system durability.
3.1 Primary Water Sources
Data centers draw water from various sources, including municipal supplies (accounting for ~ 70% of usage), groundwater aquifers, surface waters, and increasingly recycled wastewater. These support over 5,400 facilities in the US, concentrated in regions such as Northern Virginia, Dallas, Silicon Valley, and Phoenix. Designers should evaluate sources using hydrological models, prioritizing factors like availability, quality (e.g., TDS levels below 500 ppm for optimal use), and sustainability. For instance, over reliance on aquifers in arid areas like Arizona has led to well dry-ups, prompting shifts toward recycled options. Diversifying sources is used to mitigate supply disruptions and local depletion issues, thereby ensuring uninterrupted operations.
3.2 Pre-Treatment Processes and Chemical Considerations
Pre-treatment prepares inbound water by removing impurities that could cause scaling or corrosion. A typical train begins with coarse screens or filters (5-10 μm) to eliminate debris, followed by reverse osmosis (RO) modules to reduce TDS, with flux calculated as , where = iMRT (approximately 0.4 MPa for 500 ppm TDS feed, targeting ~ 75% recovery). For hardness control, softeners or ion exchange systems facilitate equilibria such as , guided by the Langelier Saturation Index , where . The Ryznar Stability Index complements LSI by offering additional assessment of scaling potential, particularly in cases where LSI may underpredict corrosion. Dosing pumps introduce antiscalants (e.g., phosphonates) and pH adjusters, while inline sensors monitor parameters to maintain LSI between -0.5 and 0.5. The engineering cost of implementing advanced systems like RO (up to $1.0m³) is weighed against the high risk of violating manufacturer warranties or failing to maintain LSI within the prescribed range, which is often a contractual obligation for system uptime. Furthermore, models like LSI and RSI are used as predictive regulatory compliance checks to prove systems are not accelerating corrosion that could lead to a catastrophic, polluting system failure.
4. Water Contamination Mechanisms
Understanding how water becomes contaminated during use is key to developing targeted treatment strategies. This section outlines thermal and chemical pollutants, models accumulation kinetics, and provides guidance on applying these concepts to prevent system degradation.
4.1 Thermal and Chemical Pollutants
As water circulates, it absorbs heat, resulting in effluent temperatures of 30 - 40°C, while accumulating chemical additives like anticorrosives (e.g., molybdate), biocides, and leached metals (Cu, Zn). Blowdown from cooling towers can concentrate total dissolved solids (TDS) to 2,000 ppm. Engineers apply mass balance models (Inflow = Outflow + Losses) to quantify these thresholds, which is essential for selecting appropriate treatment equipment to comply with discharge limits and protect downstream environments from thermal pollution or chemical excesses.
4.2 Kinetic Models of Contaminant Accumulation
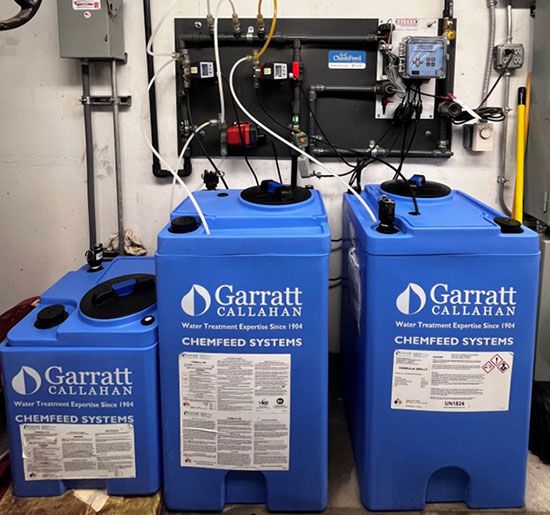
Biofouling adheres to first-order kinetics: (with k ranging from 0.1 to 0.5h-1, necessitating periodic biocide dosing through metering pumps. Corrosion rates follow Faraday's law: . Sludge settleability is assessed via the Sludge Volume Index , optimal at 80 - 150 mL/g). These models can be simulated to predict maintenance schedules, as uncontrolled accumulation can reduce heat transfer efficiency by half, underscoring the need for real-time monitoring systems like SCADA.
5. Wastewater Treatment Methods
While direct discharge to a Municipal WWTP is often the default economic choice for blowdown, a complex onsite treatment train (Sections 5.1 and 5.2) becomes a mandatory CAPEX item under three conditions: (1) Stricter NPDES Permits: Effluent exceeds municipal limits for TDS (e.g., >2,000ppm) or temperature ΔT > 5oC; (2) Water Scarcity and Reuse Mandates: The facility is in an arid area and commits to Zero-Liquid Discharge (ZLD) or high-recovery recycling (e.g., 70% recovery); or (3) Lack of WWTP Capacity: The local municipal infrastructure cannot handle the daily blowdown volume of 1.14 to 1.70 million liters. The technical models detailed below are the sizing and verification tools required when this mandatory CAPEX decision is forced by regulatory or scarcity pressures. Wastewater treatment restores water quality for potential reuse or safe discharge, employing sequenced equipment trains. This section describes physicochemical and biological/membrane techniques, instructs on their design and application, and emphasizes their role in achieving regulatory compliance and cost efficiencies.
5.1 Physicochemical Treatment Techniques
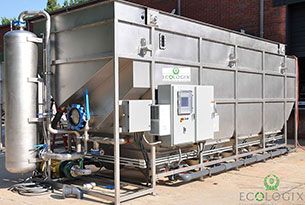
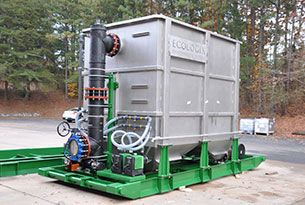
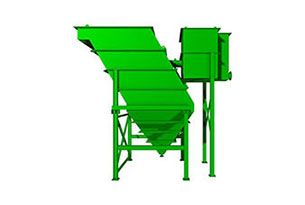
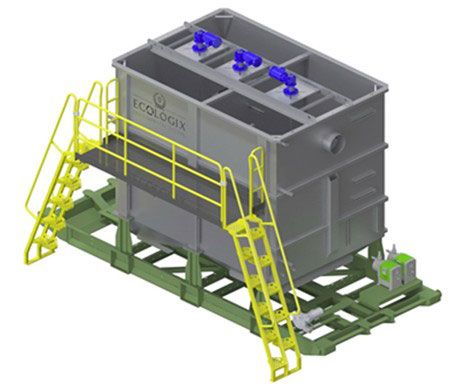
Physicochemical methods provide rapid removal of particulates and metals through a treatment train: coagulants like alum or polymers , followed by flocculation in either chemical reaction tanks or flocculation tubes to aggregate flocs under a velocity gradient . Separation occurs in dissolved air flotation (DAF) units or clarifiers, where microbubbles or sedimentation lift or settle flocculated solids, governed by Stokes' law: . Precipitation reactors with agitators dose lime to form metal hydroxides, achieving 90 - 95% removal of metals. Sludge thickeners and dewaterers manage residuals. Operators optimize the chemistry via jar testing. These methods are ideal for high-TDS blowdown due to their speed, preventing overload on downstream processes like RO.
5.2 Advanced Biological and Membrane Processes
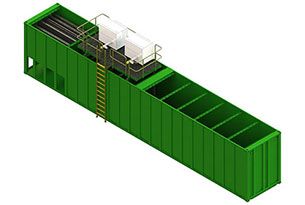
Biological and membrane processes degrade organics and polish effluents through trains starting with equalization basins to buffer variable flows, followed by aeration tanks with diffusers for activated sludge treatment, controlled by (maintaining MLSS at 2,000 - 4,000 mg/L). Secondary clarifiers settle biomass. For variable loads, moving bed biofilm reactors (MBBR) use plastic carriers to support biofilms, sized for BOD loading rates of 2 - 5 kg/m³·d. Membrane bioreactors (MBR) combine aeration with ultrafiltration (UF) membranes, achieving flux while managing fouling via and automated backwashing. These systems can deliver 95 - 99% COD/BOD removal and are often modular for scalability, making them essential for high-quality reuse and approaching zero-liquid discharge in advanced configurations.
Table 2: Comparison of Wastewater Treatment Methods in Data Centers
| Method | Efficiency (% Removal) | Energy Use (kWh/m3) | Cost ($/m3) | Common Equipment Train |
|---|---|---|---|---|
| Filtration | 80 - 90 (Solids) | 0.1 - 0.5 | 0.2 - 0.5 | Screens, Multimedia Filters |
| RO | 95 - 99 (TDS) | 1 - 3 | 0.5 - 1.0 | Pre-Filters, RO Modules, Pumps |
| Biological | 85 - 95 (BOD) | 0.5 - 1.5 | 0.3 - 0.7 | Equalization Basins, Aeration Tanks, MBBR Reactors, Clarifiers |
| Chemical Precipitation | 90 - 95 (Metals) | 0.2 - 0.8 | 0.4 - 0.8 | Dosing Tanks, Agitators, Reactors, Thickeners |
| MBR | 95 - 99 (COD/BOD) | 0.8 - 2.0 | 0.6 - 1.2 | Aeration Tanks, UF Membranes, Backwash Systems |
6. Reuse, Recycling, and Discharge Options
Following treatment, water can be reused onsite or discharged safely, influencing overall resource efficiency. This section guides the implementation of these options, incorporates hydraulic models, and explains their contributions to sustainability.
6.1 Onsite Reuse and Closed-Loop Systems
Closed-loop systems recirculate treated water or glycol mixtures through a train of storage tanks and pumps connected to chillers and heat exchangers, limiting makeup water to less than 5% annually by compensating for evaporation and leaks. Recycling involves polishing blowdown via RO or MBR to achieve 50 - 70% recovery, while "water positive" initiatives fund external replenishment projects. Engineers design these systems using mass balance equations, which are vital for reducing fresh water intake in water-scarce regions like Phoenix.
6.2 Discharge to Municipal WWTP or Environment via NPDES Permits
Discharge must comply with NPDES limits, such as TDS below 500 ppm and temperature differentials under 5°C. A typical train includes cooling ponds or towers for tempering, followed by final filters or polishers, with hydraulic loading calculated as Q/A. Modeling dilution effects ensures adherence, which is critical to avoid fines and minimize ecological impacts on receiving waters.
6.3 Water Cycle Flow in Data Centers
The water cycle in data centers follows a sequence from sourcing to potential reuse or discharge. Table 3 outlines the steps, equipment, and variations, noting that onsite treatment (steps 5 - 6) might be optional; many facilities discharge blowdown directly to municipal WWTPs if it meets the permit limits, bypassing full treatment to rely on local utility processing.
Table 3: Step-by-Step Water Cycle in Data Centers
| Step | Description | Equipment/Processes | Options/Variations |
|---|---|---|---|
| 1. Water Entry (Sources) | Water is sourced and enters the data center for initial use in cooling systems. | Pumping systems, intake filters. | Municipal supplies (70%), groundwater aquifers, surface waters, recycled wastewater. |
| 2. Pre-Treatment | Inbound water is treated to remove impurities, prevent scaling/corrosion, and prepare for cooling. | Coarse screens/filters (5-10 μm), RO modules, softeners/ion exchangers, dosing pumps for antiscalants/pH adjusters, inline sensors. | RO for TDS reduction (75% recovery), chemical softening for hardness. |
| 3. Water Use (Cooling) | Water circulates in cooling systems to absorb and dissipate heat from servers. | Cooling towers, chillers, heat exchangers. | Evaporative cooling (primary), closed-loop with glycol mixtures. |
| 4. Contamination Accumulation | Water becomes contaminated during circulation with thermal, chemical, and biological pollutants. | Monitoring via sensors for TDS, pH, metals. | Thermal (30 - 40°C), chemical (biocides, anticorrosives), metals (Cu, Zn), biofouling. |
| 5. Wastewater Treatment (Physicochemical) | Initial treatment removes particulates and metals from blowdown. | Coagulation tanks/mixers, flocculation tubes/chambers, DAF/clarifiers, precipitation reactors/agitators, sludge thickeners/dewaterers. | Coagulation/flocculation for particulates, precipitation for metals (90-95% removal). Optional step; many data centers skip full onsite treatment and discharge directly to WWTP if effluent meets basic standards. |
| 6. Wastewater Treatment (Biological/Membrane) | Advanced treatment degrades organics and polishes effluent. | Equalization basins, aeration tanks/diffusers, secondary clarifiers, MBBR reactors (plastic media), MBR (UF membranes/backwash). | Activated sludge for organics (85-95% removal), MBBR for variable loads, MBR for high-quality (95 - 99% COD/BOD). Optional step; many data centers skip full onsite treatment and discharge directly to WWTP if effluent meets basic standards. |
| 7. Reuse/Recycling | Treated water is recirculated or recycled onsite. | Storage tanks, pumps, chillers/heat exchangers, RO/MBR for polishing blowdown. | Closed-loop (makeup <5% annual), recycling (50 - 70% recovery), external replenishment. |
| 8. Discharge/Release | Effluent is discharged to WWTP or environment after final polishing. | Cooling ponds/towers, final filters/polishers. | To municipal WWTP or direct release via NPDES (TDS <500 ppm, ΔT <5°C). Direct discharge to WWTP with minimal or no onsite treatment is common if water meets local utility standards; full treatment required for stricter regulations or reuse. |
6.4 Ethical Engineering vs. Financial Offsets
While "water positive" initiatives fund external replenishment projects to offset corporate consumption, engineers must understand that they do not resolve the local hydrological depletion. Since approximately 80% of the water is consumed (evaporated) and reprecipitated elsewhere, the local water table deficit remains. Therefore, internal, technical solutions such as implementing high-recovery recycling (50 – 70% recovery) or integrating liquid immersion cooling (which cuts water usage by up to 90%) offer a superior, scientifically defensible solution to water stress than relying solely on financial offsets. Rigorous mass balance equations must be used to validate the actual on-site water reduction achieved by these engineering measures.
7. Case Studies in AI Data Center Water Management
Real-world examples demonstrate the integration of equipment and processes. Microsoft's Quincy facility employs an MBR+RO train to treat 1.8 million gallons per day for 100% onsite reuse, relieving pressure on local aquifers and serving as a model for co-located designs with municipal wastewater plants. KETOS implements AI-driven sensors for real-time contaminant monitoring, reducing discharge violations by 40% through predictive adjustments. Bloomberg's analysis of Phoenix data centers reveals annual consumption of 360 million gallons amid droughts; hybrid air-cooling systems lower WUE to 0.2 L/kWh, providing strategies for arid environments.
8. Challenges in AI Data Center Water Management
Data centers face challenges, including up to 32% increased stress on local water supplies in stressed basins, aquifer depletions leading to complaints in areas like Arizona and Georgia, and minimal employment generation (10 - 50 jobs per site) despite ownership by major operators such as AWS, Microsoft, and Google. While evaporated water re-enters the hydrologic cycle through precipitation, it causes local depletions. Although per-query energy efficiency for AI has improved by 8.5 times, overall demand continues to rise. Addressing these requires integrated modeling to forecast and mitigate impacts effectively.
9. Solutions and Future Innovations
Solutions include liquid immersion cooling in dielectric tanks, which can reduce water usage by 90%, and SCADA systems for real-time optimization of COC to minimize blowdown. Zero-water designs aim for PUE values of 1.1 by 2026. Designers should pilot these technologies to facilitate transitions, as they are used for scaling operations amid growing AI demands.
10. Conclusion
In the domain of AI data centers, wastewater treatment integrates thermodynamic, chemical, and kinetic principles to maintain system integrity amid escalating computational loads. The methodologies detailed herein from quantifying WUE and COC to configuring treatment trains like DAF-MBBR sequences and applying fouling models enable precise control over contamination and resource cycles, ensuring NPDES compliance and operational continuity. Case studies, such as Quincy's MBR-RO implementation, underscore the practicality of these approaches in addressing challenges like aquifer strain and discharge limitations. Future innovations, including immersion cooling and SCADA-optimized blowdown, demand rigorous validation through mass balance and efficiency metrics to counter rising demands. This framework positions AI data center water management as a rigorous engineering discipline, where accurate application of the outlined models and processes directly mitigates inefficiencies and regulatory risks.
11. Glossary
- AOP: Advanced Oxidation Process
- A wastewater treatment method employing reactive oxidants, such as hydroxyl radicals, to break down persistent organic contaminants and biocides in data center effluents.
- BOD: Biochemical Oxygen Demand (mg/L)
- A measure of the oxygen required by microorganisms to degrade organic matter in wastewater, indicating pollution levels in cooling system discharges.
- COC: Cycles of Concentration (dimensionless)
- The ratio of dissolved solids in recirculating cooling water to makeup water, used to optimize blowdown and minimize water usage while preventing scaling.
- COD: Chemical Oxygen Demand (mg/L)
- An indicator of the oxygen needed to oxidize organic and inorganic matter in water, assessing the organic load in data center wastewater for treatment efficacy.
- COP: Coefficient of Performance
- A ratio evaluating the efficiency of cooling systems, representing heat removed per unit of energy input in evaporative cooling processes.
- DAF: Dissolved Air Flotation
- A separation process injecting air bubbles into wastewater to float and remove suspended solids, oils, and flocs in physicochemical treatment trains.
- EDI: Electrodeionization
- A continuous demineralization process using ion-exchange membranes and electric fields to remove ions from water, often for high-purity makeup in cooling systems.
- F/M: Food-to-Microorganism Ratio (kg BOD/kgMLVSS·d)
- A parameter in biological treatment controlling the organic loading rate relative to biomass, ensuring stable microbial degradation in activated sludge systems.
- LCA: Life Cycle Assessment
- A methodology evaluating the environmental impacts of water treatment systems from raw material extraction through operation and disposal in data centers.
- LSI: Langelier Saturation Index
- An equilibrium index predicting the scaling or corrosive tendency of water based on pH, alkalinity, and calcium content in cooling circuits.
- MBBR: Moving Bed Biofilm Reactor
- A biological treatment reactor using suspended media to support biofilm growth for organic degradation, effective for variable wastewater flows in data centers.
- MBR: Membrane Bioreactor
- An integrated system combining biological degradation with membrane filtration for high-quality effluent, enabling wastewater reuse in cooling applications.
- MLSS: Mixed Liquor Suspended Solids (mg/L)
- The concentration of suspended solids in the activated sludge mixture, a key operational parameter for biological treatment efficiency.
- MLVSS: Mixed Liquor Volatile Suspended Solids (mg/L)
- The organic fraction of MLSS, representing active biomass in biological processes for degrading contaminants.
- NPDES: National Pollutant Discharge Elimination System
- A permitting program under the Clean Water Act regulating point-source discharges from data centers to protect receiving waters.
- OUR: Oxygen Uptake Rate
- The rate at which microorganisms consume oxygen in biological treatment, used to design aeration systems for wastewater oxidation.
- PUE: Power Usage Effectiveness (dimensionless)
- A metric of data center energy efficiency, indirectly influencing water usage through cooling demands.
- RO: Reverse Osmosis
- A membrane-based process removing dissolved solids and contaminants from water under pressure, essential for pre-treatment and recycling in data centers.
- RSI: Ryznar Stability Index
- An empirical index assessing water's tendency to scale or corrode, complementing LSI for cooling water management.
- SCADA: Supervisory Control and Data Acquisition
- A control system for real-time monitoring and automation of water treatment processes, optimizing parameters like COC and dosing.
- SVI: Sludge Volume Index (mL/g)
- A measure of sludge settleability in biological treatment, indicating process health and effluent clarity.
- TDS: Total Dissolved Solids (ppm)
- The concentration of inorganic and organic substances in water, a key parameter for blowdown control and discharge compliance.
- UF: Ultrafiltration
- A membrane filtration process removing particulates and macromolecules, often used in MBR for polishing wastewater.
- WWTP: Wastewater Treatment Plant
- A facility treating municipal or industrial wastewater, sometimes receiving data center discharges or providing recycled water.
- WUE: Water Usage Effectiveness (L/kWh)
- A metric quantifying water consumption relative to IT energy use, guiding efficiency improvements in cooling systems.
Have a project you would like to discuss?
Contact Ecologix Environmental Systems today to learn more about our engineered solutions.
Contact Us12. FAQ
- Is the corporate pledge to achieve “water positive” status by 2030 a
thermodynamically sound strategy, or does it merely obfuscate local hydrologic
deficits induced by evaporative cooling in arid data center hotspots?
Critics argue “water positive” claims via replenishing >100% via offsets mask local depletion, as evaporative losses reprecipitate elsewhere, not in stressed basins like Phoenix (360 million gallons/year) [46]. Mass balances (Inflow = Evap + Blowdown + Reuse) show 80% “consumed” [6], with offsets failing to address local dry-ups [4]. Microsoft's $31 million Quincy projects illustrate efforts, but spatial mismatches undermine claims [45].
- How do kinetic models of membrane fouling in reverse osmosis systems for data
center wastewater purification predict long-term flux decline, and what empirical
validations challenge their assumptions in high-TDS blowdown streams?
Fouling kinetics: [20]. For TDS >2000 ppm, scaling dominates [13]. Empirical data show 20 - 30% flux drop in 6 months, challenging constant kp assumptions; variable COC requires stochastic models [43]. Antiscalants reduce ks 50%, but Arizona validations highlight biofouling issues [15].
- What are the ramifications of proposed NPDES permit exclusions for AI data centers
on effluent TDS and temperature limits, and how do these erode downstream water
quality benchmarks under the Clean Water Act?
Exclusions relax TDS <500 ppm, ΔT<5°C, risking 15 - 20% downstream salinity rise in Northern Virginia, modeled via advection-dispersion: [26,27]. This erodes EPA's 230 mg/L Cl^-criterion; industrial waivers show 10 - 25% degradation [37].
- In the energy-water nexus of AI data centers, does the transition to liquid
immersion cooling substantively diminish resource intensity when dielectric fluid
dynamics and heat recovery coefficients are accounted for?
Immersion cuts water 90% but incurs 10 - 20% energy penalties (E=∫ P dt) due to fluid viscosity [32]. Heat recovery (70%) degrades 15% annually [12]. LCA requires PUE <1.1 for net gains; Microsoft trials confirm savings but highlight scalability limits [31].
- How does optimization of cycles of concentration (COC) in cooling towers
mathematically equilibrate scaling hazards with blowdown minimization, and what
inherent flaws in the Langelier Saturation Index compromise its predictive accuracy
for CaCO3 precipitation in data center systems?
COC optimization: , min B s.t. LSI < 0.5. LSI = pH - (pK2 - pKs p + log[Ca2+] + log[Alk]) under predicts by 20-30% at 30-40°C due to kinetic and ionic strength errors; RSI (2pHs - pH) improves accuracy [13,17].
- Are assertions of “zero-water” in closed-loop cooling systems defensible when
stochastic models incorporate variability in operational losses, such as leaks and
residual evaporation, and how do these impact long-term makeup requirements?
“Zero-water” claims falter under stochastic models (Poisson leaks: λ=0.01 - 0.05%/day), with M(t)= ∫ λ dt + ε predicting 7 - 15% makeup over 5 years [22]. Equinix data show 2 - 5% evaporation, inflating WUE 0.2 L/kWh [22].
- What reaction kinetics substantiate the superiority of advanced oxidation processes
(AOPs) over conventional methods for biocide degradation in data center effluent,
and what scale-up barriers arise in hyperscale implementations?
AOPs (UV/H2O2) degrade biocides via Rate=k[•OH][Biocide](k = 108 - 1010M-1 s-1 ), achieving 95% removal in 30 min vs. chlorination's 80% [18]. Scale-up energy (1 - 3 kWh/m³) raises costs 20 - 50%; fouling cuts quantum yield 30% [43].
Bibliography
- https://spectrum.ieee.org/ai-water-usage
- https://kanoppi.co/search-engines-vs-ai-energy-consumption-compared/
- https://news.lenovo.com/data-centers-worlds-ai-generators-water-usage/
- https://www.lawfaremedia.org/article/ai-data-centers-threaten-global-water-security
- https://www.nature.com/articles/s41545-021-00101-w
- https://www.eesi.org/articles/view/data-centers-and-water-consumption
- https://www.asce.org/publications-and-news/civil-engineering-source/civil-engineering-magazine/issues/magazine-issue/article/2024/03/engineers-often-need-a-lot-of-water-to-keep-data-centers-cool
- https://dgtlinfra.com/top-data-center-companies/
- https://dgtlinfra.com/data-center-water-usage/
- https://www.datacentermap.com/usa/
- https://www.nytimes.com/2025/07/14/technology/meta-data-center-water.html
- https://amiad.com/blog/why-water-treatment-is-critical-for-data-center-cooling-systems/
- https://www.chemtreat.com/resource/a-practical-guide-to-sustainable-cooling-practices-for-data-centers/
- https://ketos.co/ai-data-centers-wastewater-discharge-and-the-growing-need-for-effective-water-management
- https://www.watertechnologies.com/industries/data-centers
- https://www.solenis.com/en/markets/industrial/data-centers/
- https://www.csemag.com/best-practices-for-water-treatment-in-data-center-cooling/
- https://purite.com/diving-into-efficiency-the-role-of-water-treatments-in-data-centres/
- https://www.wateronline.com/doc/water-conservation-and-reuse-for-data-centers-0001
- https://www.techtarget.com/searchdatacenter/tip/Maximizing-water-recycling-in-modern-data-center-design
- https://www.waterboards.ca.gov/drinking_water/certlic/drinkingwater/onsite_nonpotable_reuse_regulations.html
- https://blog.equinix.com/blog/2024/09/19/how-data-centers-use-water-and-how-were-working-to-use-water-responsibly/
- https://www.weforum.org/stories/2024/11/circular-water-solutions-sustainable-data-centres/
- https://blogs.microsoft.com/blog/2020/09/21/microsoft-will-replenish-more-water-than-it-consumes-by-2030/
- https://www.epa.gov/cwa-404/exemptions-permit-requirements-under-cwa-section-404
- https://www.whitehouse.gov/presidential-actions/2025/07/accelerating-federal-permitting-of-data-center-infrastructure/
- https://www.ceres.org/resources/reports/drained-by-data-the-cumulative-impact-of-data-centers-on-regional-water-stress
- https://www.bbc.com/news/articles/cy8gy7lv448o
- https://www.wsj.com/tech/ai/data-center-job-creation-48038b67
- https://www.reddit.com/r/environment/comments/16fhjz0/what_do_people_mean_when_a_data_center_consumes/
- https://arxiv.org/html/2509.07218v1
- https://www.microsoft.com/en-us/microsoft-cloud/blog/2024/12/09/sustainable-by-design-next-generation-datacenters-consume-zero-water-for-cooling/
- https://www.projectfinance.law/publications/2025/july/data-centers-and-water/
- https://www.datacenterdynamics.com/en/news/microsofts-upcoming-data-centers-to-use-closed-loop-zero-water-evaporation-design/
- https://www.tn.gov/content/dam/tn/environment/water/ftc/references/formula-conversions/ftc_ww-mathematical-formulas.pdf
- https://www.gov.mb.ca/sd/pubs/waste_management/wastewater/metric_math_for_wastewater_operators.pdf
- https://www.des.nh.gov/sites/g/files/ehbemt341/files/inline-documents/sonh/ww-math-formulas.pdf
- https://dl.icdst.org/pdfs/files3/606b562d982efd43d4d7fadd0394d45e.pdf
- https://www.deq.nc.gov/water-quality/operator-certification-files/dw-files/dw-downloads/formulas-well-surface-2015/download
- https://eocp.ca/wp-content/uploads/2022/05/2022-Guide-to-the-EOCP-and-ABC-formulas.pdf
- https://www.epa.gov/compliance/math-wastewater-operators
- https://www.deq.nc.gov/water-resources/pws/ww-operator-certification/202105-math-formulas-ww-cs-pcpdf/download?attachment
- https://www.sciencedirect.com/science/article/pii/S0307904X11007165
- https://ketos.co/ai-data-centers-wastewater-discharge-and-the-growing-need-for-effective-water-management
- https://www.epa.gov/waterreuse/water-reuse-case-study-quincy-washington
- https://www.bloomberg.com/graphics/2025-ai-impacts-data-centers-water-data/
Have a project you would like to discuss?
Contact Ecologix Environmental Systems today to learn more about our engineered solutions.
Contact Us